
U.S. Department of Labor
Mine Safety and Health Administration
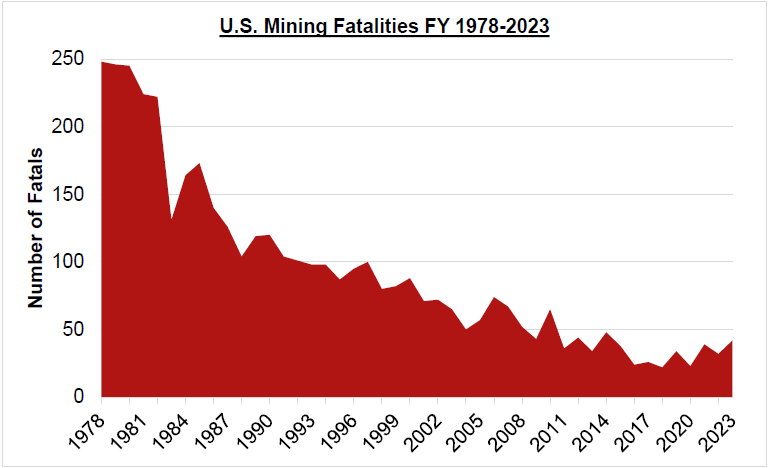
Safety and health in America’s mining industry made significant strides during the 20th century and over the last 44 years in particular. In 1978, the first year the Mine Safety and Health Administration (MSHA) operated under the new Federal Mine Safety and Health Act of 1977, 242 miners died in mining accidents. MSHA continues to work to reduce injuries, illnesses and death through strong enforcement as well as active outreach, education and training, and technical support to the mining industry.
MSHA’s Mine Safety and Health at a Glance page is updated biannually.
Last updated: December 4, 2023.
All Mine Safety and Health
| Topic | 2017 | 2018 | 2019 | 2020 | 2021 | 2022 | 2023 |
|---|---|---|---|---|---|---|---|
| Number of Mines | 13,190 | 13,164 | 13,105 | 12,919 | 12,686 | 12,701 | 12,671 |
| Number of Miners* | 322,321 | 332,546 | 336,312 | 305,897 | 298,574 | 313,504 | 322,365 |
| Fatalities* | 26 | 22 | 34 | 23 | 39 | 32 | 42 |
| Fatal Injury Rate1* | .0097 | .0078 | .0119 | .0090 | .0156 | .0119 | .0151 |
| All Injury Rate1* | 2.19 | 2.08 | 2.06 | 1.90 | 1.91 | 1.88 | 1.84 |
| Total Mining Area Inspection Hours/Mine2 | 53 | 50 | 48 | 42 | 39 | 40 | 41 |
| Citations and Orders Issued3, 4 | 103,425 | 99,597 | 99,542 | 82,781 | 76,994 | 85,736 | 94,445 |
| S&S Citations and Orders (%) | 21% | 20% | 20% | 18% | 19% | 19% | 19% |
| Dollar Amount Assessed (Millions)4 | 54.7 | 55.6 | 55.0 | 42.2 | 40.9 | 54.6 | 67.1 |
*Values are all inclusive of operator and contractor employees.
Coal Mine Safety and Health
| Topic | 2017 | 2018 | 2019 | 2020 | 2021 | 2022 | 2023 |
|---|---|---|---|---|---|---|---|
| Number of Coal Mines | 1,225 | 1,188 | 1,160 | 1,057 | 964 | 991 | 1,005 |
| Number of Miners* | 83,478 | 83,023 | 83,281 | 68,370 | 60,716 | 65,832 | 68,193 |
| Fatalities* | 14 | 9 | 15 | 3 | 12 | 12 | 10 |
| Fatal Injury Rate1* | .0189 | .0118 | .0194 | .0051 | .0225 | .0201 | .0155 |
| All Injury Rate1* | 3.12 | 2.96 | 2.94 | 2.82 | 2.85 | 2.83 | 2.72 |
| Coal Production (Millions of Tons) | 780 | 757 | 734 | 567 | 565 | 596 | 583 |
| Total Mining Area Inspection Hours/Mine2 | 250 | 244 | 241 | 208 | 204 | 215 | 220 |
| Citations and Orders Issued3, 4 | 46,745 | 46,170 | 45,637 | 31,176 | 29,037 | 34,591 | 39,657 |
| S&S Citations and Orders (%) | 21% | 20% | 20% | 17% | 18% | 19% | 20% |
| Dollar Amount Assessed (Millions)4 | 27.3 | 30.3 | 29.8 | 18.7 | 16.3 | 24.6 | 30.5 |
*Values are all inclusive of operator and contractor employees.
Metal and Nonmetal Mine Safety and Health
| Topic | 2017 | 2018 | 2019 | 2020 | 2021 | 2022 | 2023 |
|---|---|---|---|---|---|---|---|
| Number of Metal/Nonmetal Mines | 11,965 | 11,976 | 11,945 | 11,862 | 11,722 | 11,710 | 11,666 |
| Number of Miners* | 238,843 | 249,523 | 253,031 | 237,527 | 237,858 | 247,672 | 254,172 |
| Fatalities* | 12 | 13 | 19 | 20 | 27 | 20 | 32 |
| Fatal Injury Rate1* | .0062 | .0063 | .0091 | .0102 | .0138 | .0096 | .0149 |
| All Injury Rate1* | 1.83 | 1.75 | 1.74 | 1.63 | 1.65 | 1.61 | 1.58 |
| Total Mining Area Inspection Hours/Mine2 | 22 | 22 | 22 | 21 | 20 | 20 | 20 |
| Citations and Orders Issued3, 4 | 56,680 | 53,427 | 53,905 | 51,605 | 47,957 | 51,145 | 54,788 |
| S&S Citations and Orders (%) | 22% | 21% | 20% | 18% | 19% | 19% | 19% |
| Dollar Amount Assessed (Millions)4 | 27.5 | 25.4 | 25.2 | 23.4 | 24.6 | 29.9 | 36.7 |
*Values are all inclusive of operator and contractor employees.
Mine Contractors
| Topic | 2017 | 2018 | 2019 | 2020 | 2021 | 2022 | 2023 |
|---|---|---|---|---|---|---|---|
| Coal Fatalities5 | 1 | 0 | 3 | 0 | 3 | 2 | 4 |
| MNM Fatalities5 | 2 | 0 | 7 | 4 | 5 | 4 | 6 |
| Total Fatalities5 | 3 | 0 | 10 | 4 | 8 | 6 | 10 |
| Coal Fatal Injury Rate1 | .0070 | .0000 | .0194 | .0000 | .0299 | .0180 | .0328 |
| MNM Fatal Injury Rate1 | .0060 | .0000 | .0186 | .0120 | .0144 | .0099 | .0142 |
| Total Fatal Injury Rate1 | .0063 | .0000 | .0188 | .0090 | .0179 | .0117 | .0184 |
- Reported injuries per 200,000 hours worked.
- Total Mining Area Time includes: On-site Inspection Time (M/NM), MMU Pit Time (Coal), Outby Area Time (Coal), Surface Area Time (Coal), Citation/Order writing On-Site. On-site inspection hours represent hours entered by Authorized Representatives of the Secretary (AR) for certain inspection activities and task codes.
- Citations and orders are those not vacated.
- Citations and Orders issued, and Dollar Amount Assessed, are based on issue date. Therefore, citation counts and dollars assessed can fluctuate, upwards or downwards, depending on the date information was pulled. For example, numbers tend to fluctuate downwards when an issued citation is either conferenced or contested and is subsequently vacated. Dollars assessed can fluctuate upwards when there is a lag time between the issuance date and the assessed date.
- Contractor fatalities are not exclusive to those reported in the All Mine Safety and Health; Coal Mine Safety and Health; and, Metal and Nonmetal Mine Safety and Health sections of this report.
For more information:
www.msha.gov - MSHA Office of Program Education and Outreach Services, (202) 693-9400