
U.S. Department of Labor
Mine Safety and Health Administration
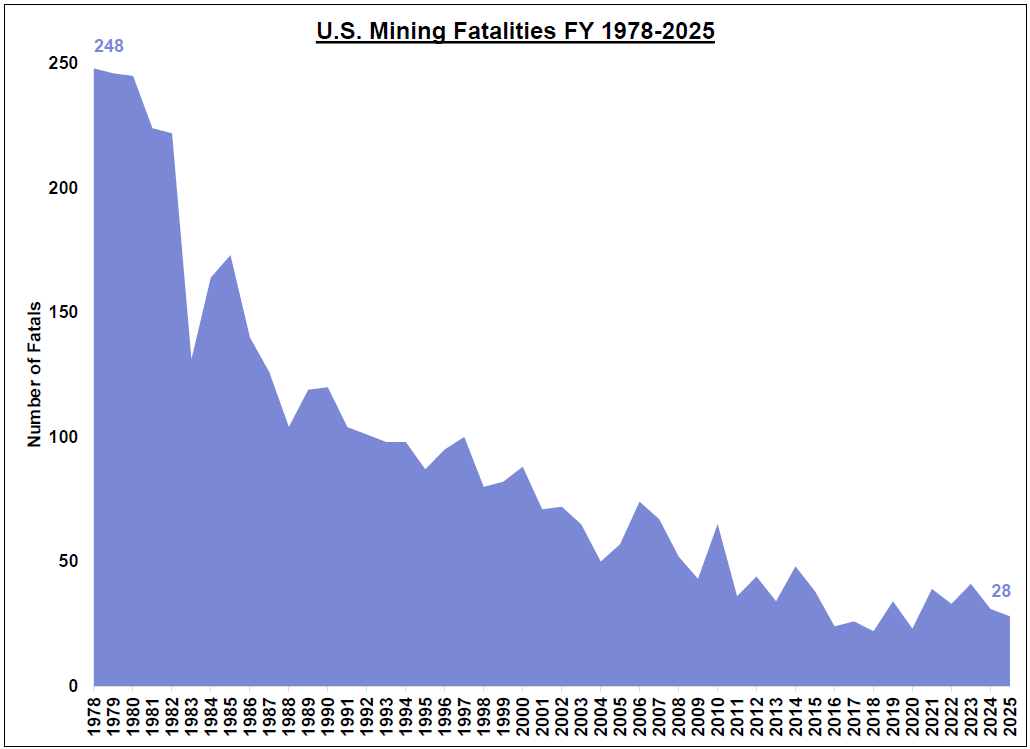
Safety and health in America’s mining industry made significant strides during the 20th century and over the last 47 years in particular. In 1978, the first year the Mine Safety and Health Administration (MSHA) operated under the new Federal Mine Safety and Health Act of 1977, 248 miners died in mining accidents. MSHA continues to work to reduce injuries, illnesses and death through strong enforcement as well as active outreach, education and training, and technical support to the mining industry.
MSHA’s Mine Safety and Health At A Glance page is updated biannually.
Last updated: February 27, 2026.
All Mining Safety and Health
| Category | 2019 | 2020 | 2021 | 2022 | 2023 | 2024 | 2025 |
|---|---|---|---|---|---|---|---|
| Number of Mines | 13,105 | 12,920 | 12,687 | 12,702 | 12,740 | 12,789 | 12,568 |
| Number of Miners* | 336,322 | 305,929 | 298,596 | 313,624 | 324,903 | 330,122 | 327,465 |
| Fatalities* | 34 | 23 | 39 | 33 | 41 | 31 | 28 |
| Fatal Injury Rate1* | .0119 | .0090 | .0156 | .0123 | .0146 | .0110 | .0101 |
| All Injury Rate1* | 2.06 | 1.90 | 1.91 | 1.89 | 1.85 | 1.82 | 1.77 |
| Total Mining Area Inspection Hours/Mine2 | 48 | 42 | 39 | 40 | 41 | 42 | 41 |
| Citations and Orders Issued3,4 | 99,541 | 82,781 | 76,983 | 85,716 | 94,045 | 94,352 | 87,372 |
| S&S Citations and Orders (%) | 20% | 18% | 19% | 19% | 19% | 18% | 18% |
| Dollar Amount Assessed (Millions)4 | 55.0 | 42.2 | 40.9 | 54.6 | 69.4 | 71.1 | 62.4 |
*Values are all inclusive of operator and contractor employees.
Coal Mine Safety and Health
| Category | 2019 | 2020 | 2021 | 2022 | 2023 | 2024 | 2025 |
|---|---|---|---|---|---|---|---|
| Number of Coal Mines | 1,158 | 1,055 | 962 | 989 | 1,006 | 952 | 886 |
| Number of Miners* | 83,277 | 68,368 | 60,714 | 65,836 | 68,499 | 68,462 | 62,901 |
| Fatalities* | 15 | 3 | 12 | 12 | 10 | 11 | 5 |
| Fatal Injury Rate1* | .0194 | .0051 | .0225 | .0201 | .0155 | .0174 | .0085 |
| All Injury Rate1* | 2.94 | 2.82 | 2.86 | 2.85 | 2.76 | 2.79 | 2.73 |
| Coal Production (Millions of Tons) | 734 | 567 | 565 | 596 | 583 | 525 | 523 |
| Total Mining Area Inspection Hours/Mine2 | 242 | 209 | 204 | 216 | 221 | 225 | 224 |
| Citations and Orders Issued3,4 | 45,635 | 31,175 | 29,037 | 34,587 | 39,566 | 38,880 | 35,016 |
| S&S Citations and Orders (%) | 20% | 17% | 18% | 19% | 19% | 19% | 18% |
| Dollar Amount Assessed (Millions)4 | 29.8 | 18.7 | 16.3 | 24.6 | 31.1 | 34.0 | 29.1 |
*Values are all inclusive of operator and contractor employees.
Metal and Nonmetal Mine Safety and Health
| Category | 2019 | 2020 | 2021 | 2022 | 2023 | 2024 | 2025 |
|---|---|---|---|---|---|---|---|
| Number of Metal/Nonmetal Mines | 11,947 | 11,865 | 11,725 | 11,713 | 11,734 | 11,837 | 11,682 |
| Number of Miners* | 253,045 | 237,561 | 237,882 | 247,788 | 256,404 | 261,660 | 264,564 |
| Fatalities* | 19 | 20 | 27 | 21 | 31 | 20 | 23 |
| Fatal Injury Rate1* | .0091 | .0102 | .0138 | .0101 | .0143 | .0091 | .0105 |
| All Injury Rate1* | 1.74 | 1.63 | 1.65 | 1.61 | 1.58 | 1.54 | 1.52 |
| Total Mining Area Inspection Hours/Mine2 | 22 | 21 | 20 | 20 | 20 | 20 | 21 |
| Citations and Orders Issued3,4 | 53,906 | 51,606 | 47,946 | 51,129 | 54,479 | 55,472 | 52,356 |
| S&S Citations and Orders (%) | 20% | 18% | 19% | 19% | 19% | 17% | 17% |
| Dollar Amount Assessed (Millions)4 | 25.2 | 23.4 | 24.6 | 29.9 | 38.3 | 37.1 | 33.2 |
*Values are all inclusive of operator and contractor employees.
Mine Contractors
| Category | 2019 | 2020 | 2021 | 2022 | 2023 | 2024 | 2025 |
|---|---|---|---|---|---|---|---|
| Coal Fatalities5 | 3 | 0 | 3 | 2 | 4 | 1 | 1 |
| MNM Fatalities5 | 7 | 4 | 5 | 4 | 5 | 8 | 6 |
| Total Fatalities5 | 10 | 4 | 8 | 6 | 9 | 9 | 7 |
| Coal Fatal Injury Rate1 | .0194 | .0000 | .0299 | .0180 | .0324 | .0083 | .0094 |
| MNM Fatal Injury Rate1 | .0186 | .0120 | .0144 | .0099 | .0115 | .0185 | .0136 |
| Total Fatal Injury Rate1 | .0188 | .0090 | .0179 | .0116 | .0162 | .0163 | .0128 |
- Injury rates are calculated per 200,000 employee hours worked.
- Total Mining Area Inspection Hours/Mine includes surface and underground inspection hours divided by the number of mines.
- Citations and orders issued under the Federal Mine Safety and Health Act of 1977.
- Includes both Coal and Metal/Nonmetal. Dollar amounts assessed may not match collections due to contest, settlement, or reduction by the Federal Mine Safety and Health Review Commission.
- Contractor fatalities are included in the Coal and Metal/Nonmetal totals above.